
Strategic Intelligence & Computational Economics
We combine advanced data science with economic modeling to de-risk policy and investment decisions. From natural language processing to global capability mapping, we turn unstructured data into evidence.
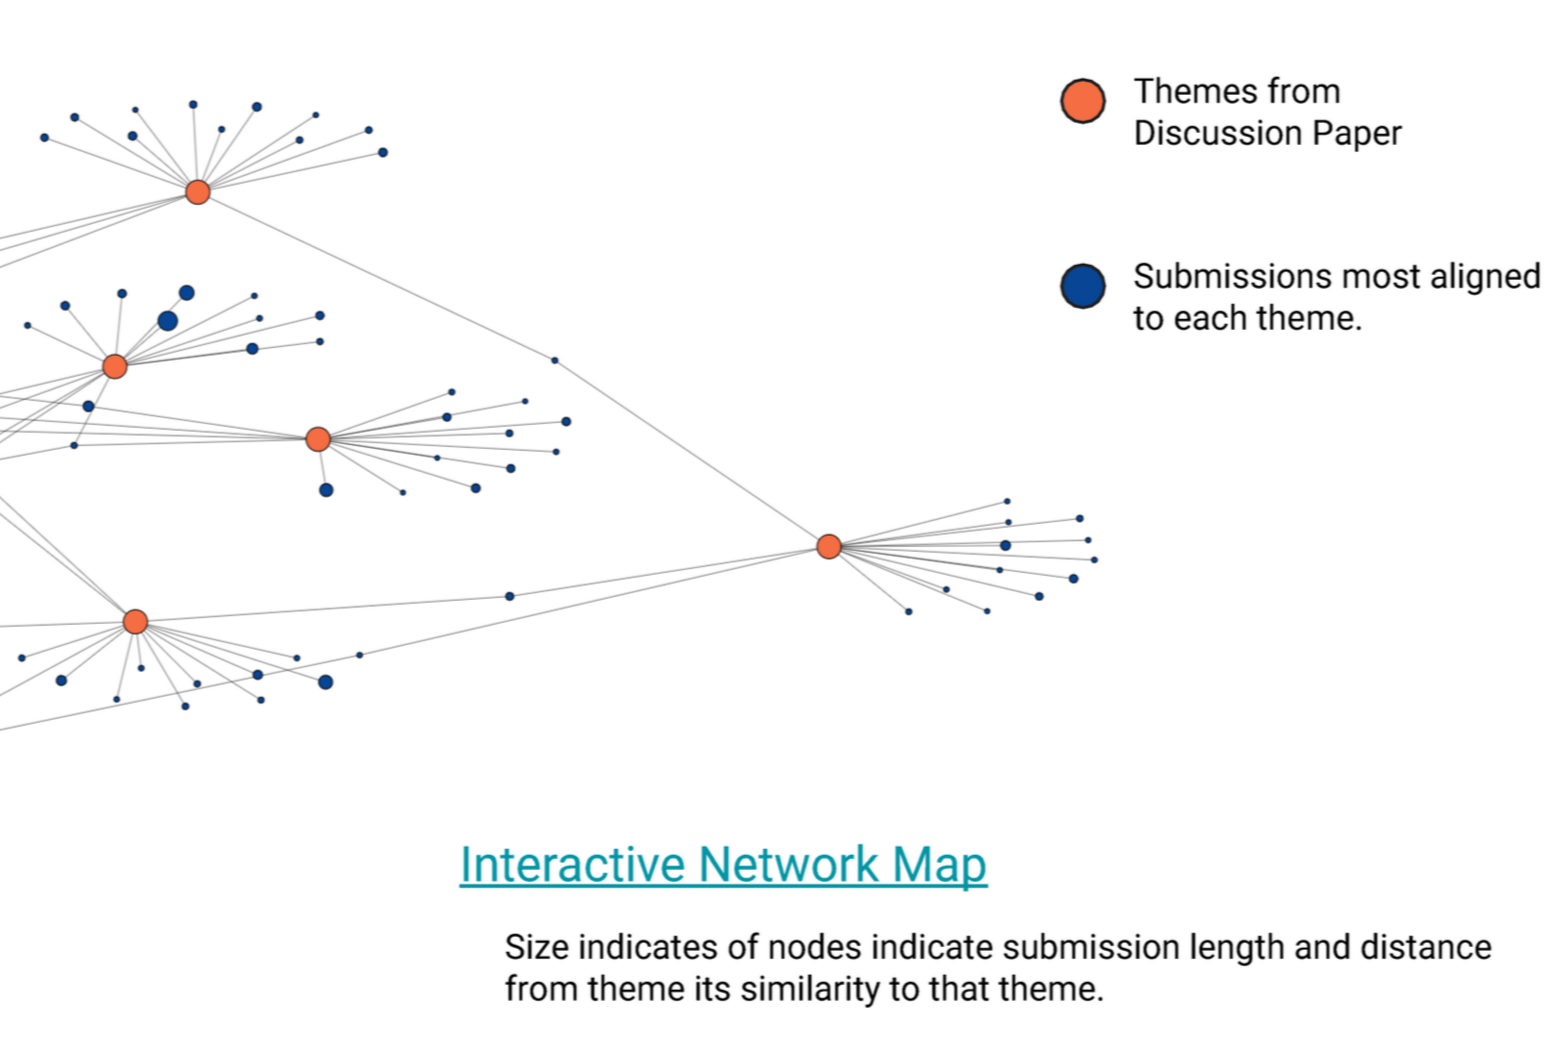
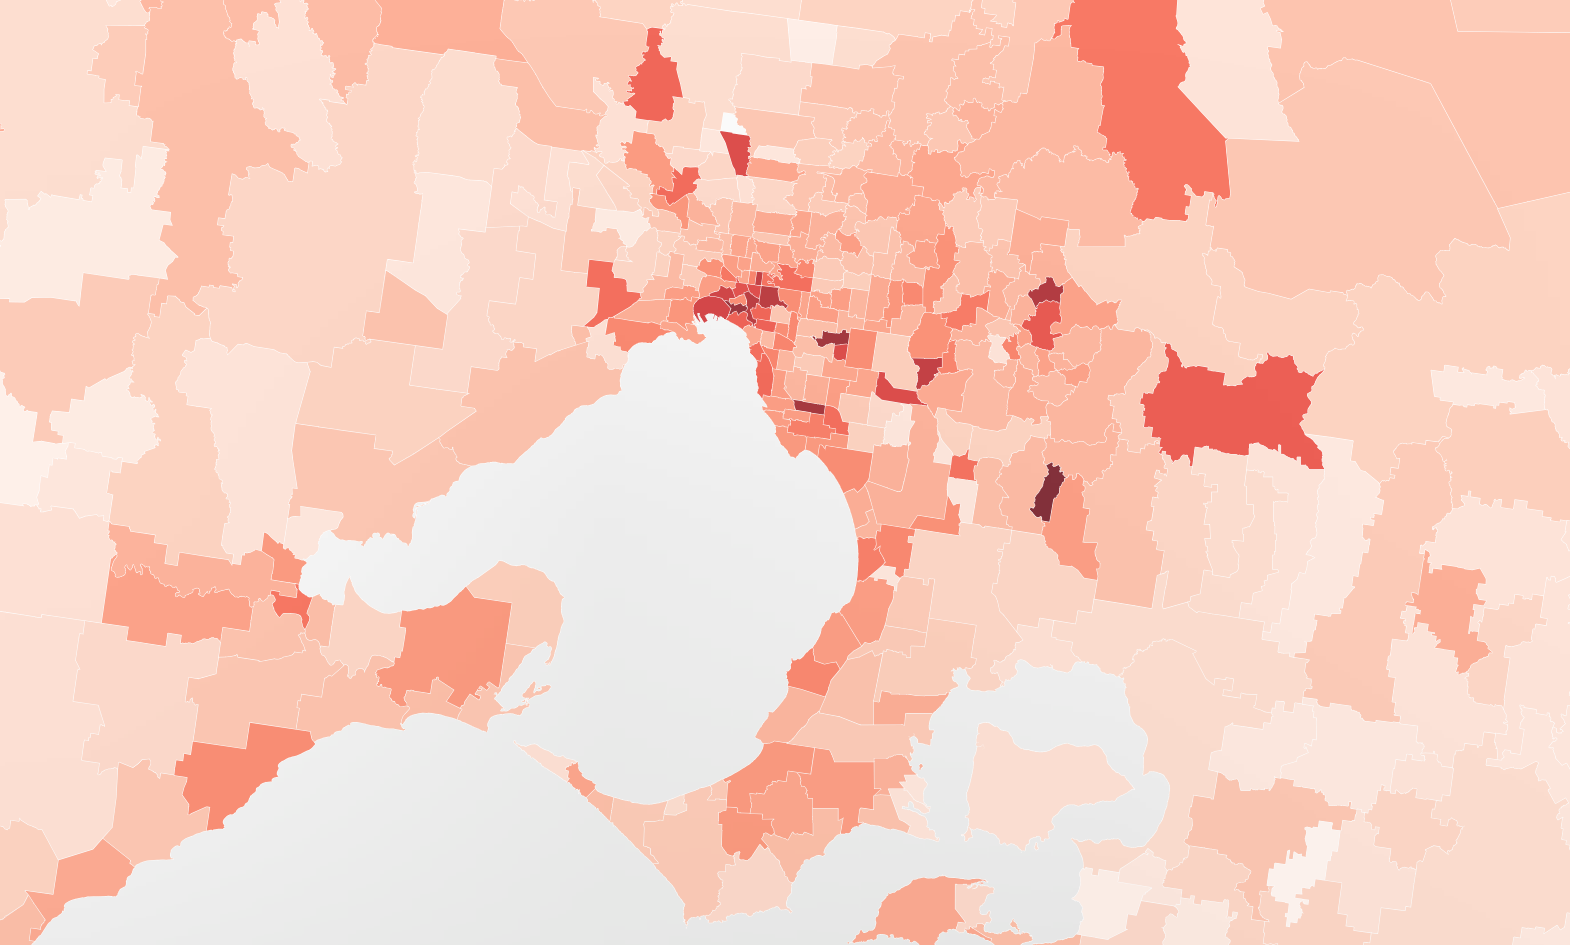
Natural language processing
We decode the voice of the public and the economy.
Without any hallucinations, we apply proven transparent NLP models to analyse thousands of unstructured public and Government submissions, such as for the Universities Accord to identify thematic clusters, and provide hallucination-free evidence-based insights for complex policy challenges.
View insights:
Universities Accord Submissions Analytics
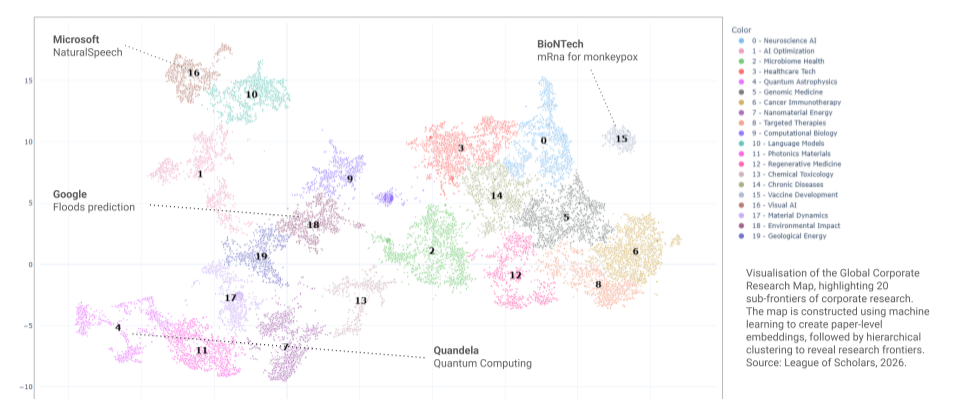
Capability Mapping
We map the invisible geometry of innovation.
Powering the Nature’s analysis of Global Corporate Research and The Australian’s RESEARCH magazine, our algorithms visualise the global flow of talent and knowledge, helping Governments and Universities to benchmark their comparative advantage against the world.
Global Benchmarks:
Nature Index Science Inc.
The Australian’s RESEARCH magazine 2026
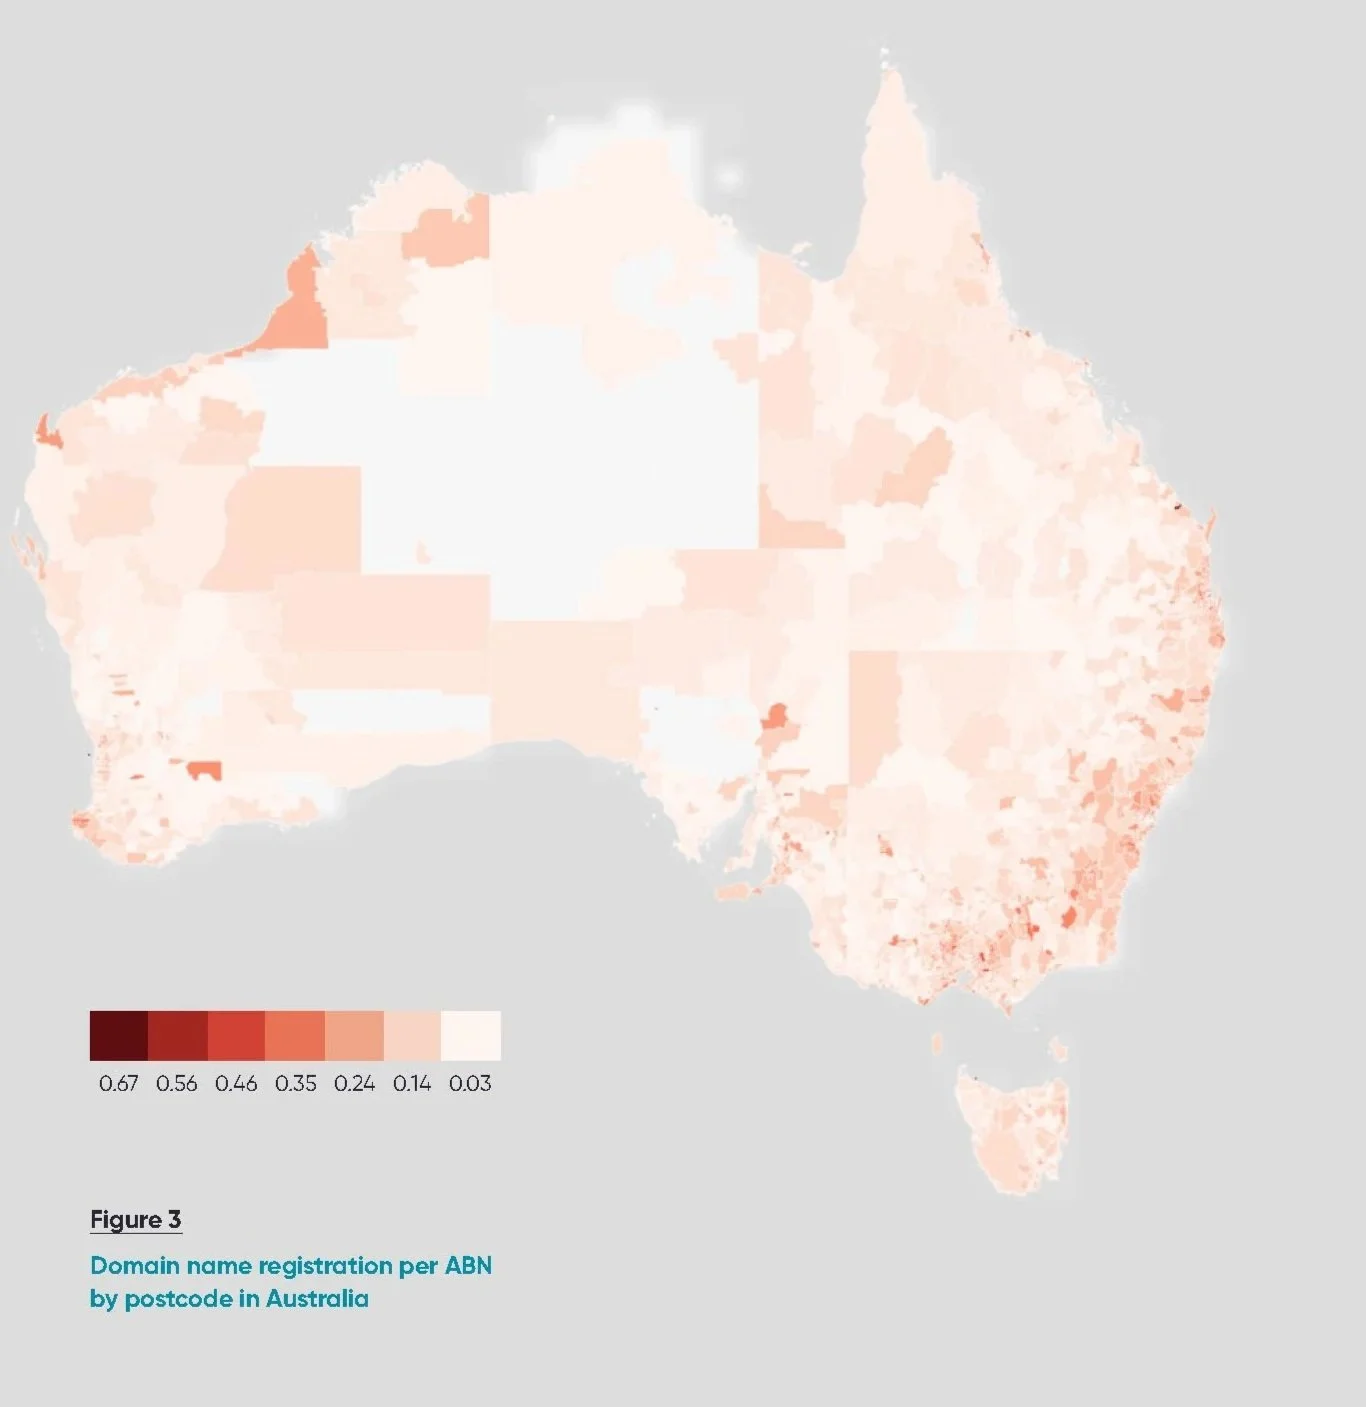
Predictive Machine Learning
We model the drivers of future performance.
Whether identifying the DNA of successful global startups or mapping the 'Internet Economy' with AuDA, we use high-dimensional vector mapping to forecast economic and investment patterns, technology frontiers and revealed comparative advantage.
Forecasts & Models:
Atlas of Australia Online

“League of Scholars used an algorithm to analyse the titles and abstracts of 35,000 corporate co-authored papers... clustering them by topic to reveal the world's emerging technology frontiers.”
Trusted by the world's leading data publishers.
— Nature Index's Science Inc. Global Analytics Partner
